Point Of ControlStrategy and indicators are explained on the Chart.
Here's how i read the chart.
Entry:
1. Let the price close above the Ichimoku cloud
2. Price is above Volume Support zone
2. Make sure that momentum indicated with Green Triangles for Long Position
Exit:
1. Orange cross at the bottom of the candle indicates price is about to weaken
2. Best time to exit is Volume Resistance + Bearish(Hammer or Engulf )
PS: Use it along with R-Smart for better results
Cerca negli script per "Ichimoku Cloud "

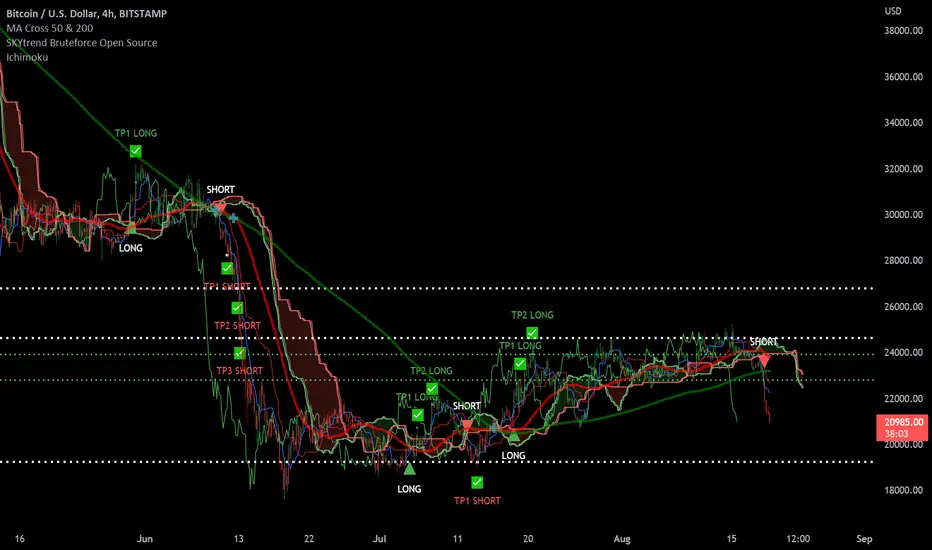
SKYtrend Bruteforce Open Source✨SKYtrend Bruteforce Now Open Source✨
📌This indicator analyzes the trend and calls Long/Short which is fully custom to fit your style of trading.
📌Custom Take Profit Levels currently have 3 TP levels for Long and Short you can decide which % each TP will be in settings.
📌2 Custom Stoploss levels. For Long or Short. Can Enable or Disable either.
📌Can set alert For Long, Short , TP Long 1-3, TP Short 1-3, SL 1-2
📌Has built in ichimoku cloud
If you like it, like it. :)
atnX_2According to the Ichimoku cloud, this script provides the opportunity to buy, sell, and determine the trend direction by signaling at the point where the EMA 5/10 intersections are located and gives you the opportunity to successfully indicate when you will exit the commodity that I like the most.
Investor_coin is my mentor to create such a well-working script.
@melihtuna did the coding.

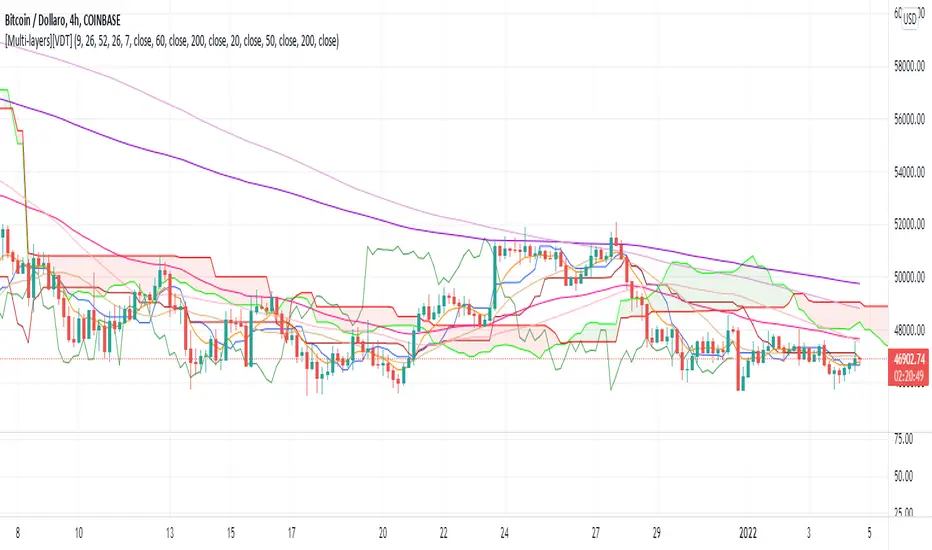
[Multi-layers][VDT]New multi-indicator to merge together three of the most popular indicators used by traders in technical analysis:
1) Ichimoku Cloud, with parameters editable by the trader. Default parameters are: 9-26-52-26
2) 3X Simple Moving Average (SMA), with periods editable by the trader. Default periods are: 20-50-200
3) 3X Exponential Moving Average (EMA), with periods editable by the trader. Default periods are: 7-60-200
Traders can decide whether to print or to hide each indicators separately in the graph, creating three different overlays.
T/K CROSSSimple crossing of the Tenkan & Kijun Sen indicated by a "Cross". Surfed Tradingview for it, but did not find it, so decided to make one. Does NOT include the Ichimoku Cloud & the Chikou

MTF Bullish/Bearish IndicatorThe script plots a bullish/bearish indicator by evaluating a variety of moving averages for a security across multiple timeframes. It's derived from built in Technical Analysis indicator published by TradingView. The result of evaluation is plotted on the chart in green light/red light format in a configurable location.
evaluated moving averages include
- SMA 10, 20, 30, 50, 100, 200
- EMA 10, 20, 30, 50, 100, 200
- Hull MA 9
- VWMA 20
- Ichimoku Cloud
moving averages are evaluated at chart timeframes and 5 min, 15 min, 30 min, 120 min, 240 min, and daily by default but can be customized.

TK Cross and Kumo Twist AlertBased on the ichimoku cloud system, this shows on a chart where Tenkan-Kijun cross happens and when a Kumo Twist happens.

Specific Date Series (llnylk's)Show specific dates/bars (useful for Ichimoku cloud)
Show where are -9th bar, -20th bar, -26th bar, -52th bars in the past

Technical Analysis Consulting Table (TACT)Inspired by Tradingview's own "Technical Analysis Summary", I present to you a table with analogous logic.
You can track any ticker you want, no matter your chart. You can even have multiple tables to track multiple tickers. By default it tracks the Total Crypto Cap.
You can change the resolution you want to track. By default it is the same as the chart.
You can position the table to whichever corner of the chart you want. By default it draws in the bottom right corner.
Background colors and text size can be adjusted.
Indicators Used:
Oscillators
RSI(14)
STOCH(14, 3, 3)
CCI(20)
ADX(14)
AO
Momentum(10)
MACD(12, 26)
STOCH RSI(3, 3, 14, 14)
%R(14)
Bull Bear Power
UO(7,14,28)
Moving Averages
EMA(5)
SMA(5)
EMA(10)
SMA(10)
EMA(20)
SMA(20)
EMA(30)
SMA(30)
EMA(50)
SMA(50)
EMA(100)
SMA(100)
EMA(200)
SMA(200)
Ichimoku Cloud(9, 26, 52, 26)
VMWA(20)
HMA(9)
Pivots
Traditional
Fibonacci
Camarilla
Woodie
WARNING: I have observed up to a couple of seconds of signal jitter/delay, so use it with caution in very small resolutions (1s to 1m).
I hope you enjoy this and good luck with your trading. Suggestions and feedback are most welcome.

BTC_ISHIMOKUInvestment trading strategy on the daily timeframe of the BTC-USD pair based on the Ichimoku cloud indicator

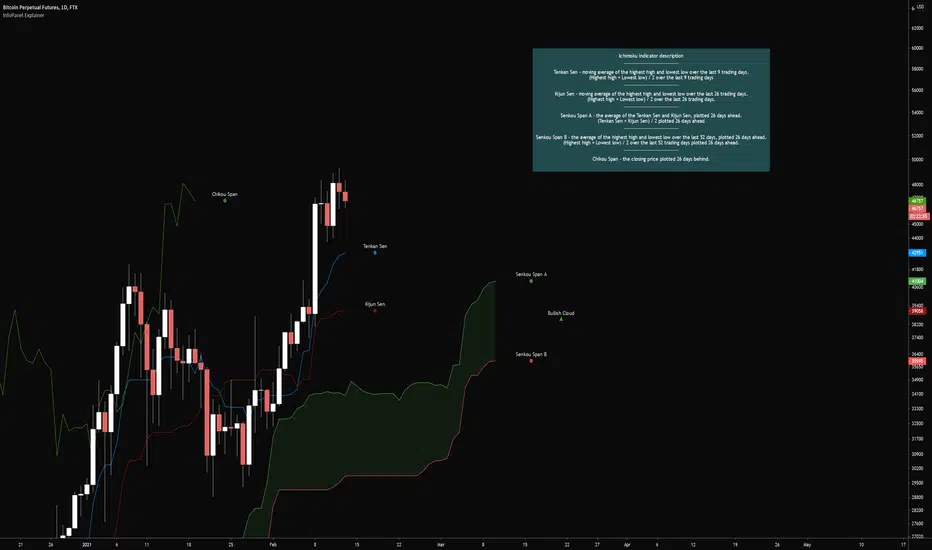
InfoPanel ExplainerCredits to @RicardoSantos for the infopanel script (www.tradingview.com)
Publishing this to hopefully start a common practice for indicators with multiple signals/rules to add an explanation of them into the indicator itself.
This would make it easier to learn new indicator setups when the reference material is all on one webpage.
May or may not be helpful to others but I needed it for something.
The indicator has inputs for where the label should go, the text size, whether or not to display the infopanel, and changing the colors for the text and background. I tried making it user friendly as possible
The example used is showcasing what the plots are in the ichimoku cloud indicator.
MAs and Oscillators SummeryHello
This indicator represents the Tradingview screener three rating criteria
Moving Averages Summary: Average of the most important moving averages, except the Ichimoku cloud as it's a very old technology which is not reliable.
Oscillators Summary: Average of the major Oscillators.
Summary rating: which is average of above two indices
It has also an option to view the weekly summary rating with any time frame you are using at the same time

MACD Trend CandlesThe script combines 2 indicators (MACD and Stoch-RSI) and puts them visually directly on the candles - can be used with normal OHLC candles or Heiken Ashi candles. Furthermore, you can derive divergences exremely easy directly visually from the candles as well. Lastly, a SMA 20 high and a SMA 20 low line build a trend channel.
Script is best used in trending markets to trade with the trend.
1) SMA trend channel:
* uptrend: close above
* downtrend: close below
* aggressive entry (uptrend) closing inside channel from below
* conservative entry (uptrend) closing above channel from inside
* hold (uptrend) until close below channel
* can be used accordingly for the downtrend
2) MACD candles
* visualization of the MACD histogram directly on the candles
* dark blue: histogram > 0 and histogram > histogram of previous candle
* light blue: histogram > 0 and histogram < histogram of previous candle
* orange: histogram < 0 and histogram < histogram of previous candle
* light blue: histogram < 0 and histogram > histogram of previous candle
* hold uptrend (dark/light blue candles) - combined with trend channel (above channel)
* hold downtrend (orange /yellow candles) - combined with trend channel (below channel)
* Color divergence: light blue candle > dark blue candle (price and MACD show divergence (bearish)
* Color divergence: yellow candle < orange candle (price and MACD show divergence (bullish)
* Trend change (0 line cross to upside) yellow or orange to dark blue
* Trend change (0 line cross to downside) dark or light blue to orange
3) Stoch RSI diamonds
* visualization of the STOCH-RSI as diamonds above or below the candle
* k, d line > 80: diamond above the candle
* k, d line < 20: diamond below the candle
* divergence caldle without diamond above > candle with diamond above (bearish divergence)
* divergence caldle without diamond below < candle with diamond below (bullish divergence)
Feel free to test each part individually and combine it with other indicators, e.g. BBands and Ichimoku Cloud - you will see it is a powerful visualization script
HAVE FUN

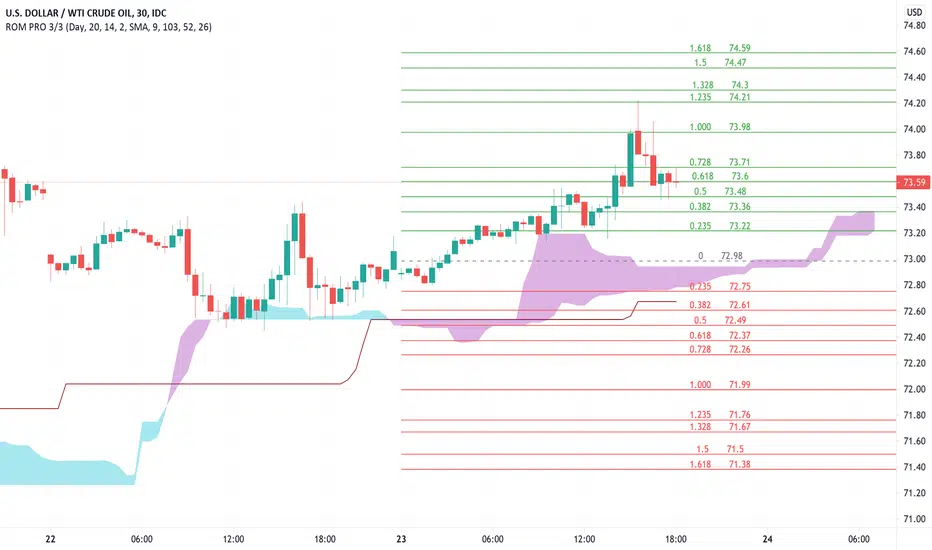
Rain On Me PRO 3/3This is the part 3 of Rain On Me PRO. It follow my two other indicators "Rain On Me" and "Rain On Me V2". This version is called "PRO" because it is less "user-friendly" than the two previous versions. But it is more faster, and cleaner than ever!
This indicator is separated into 3 parts. You can find all parts into my profile in the « Scripts » section. Once the 3 parts together, the indicator is complete.
Here are the features for this part:
-MTF Fibonacci on 10 levels with level 0 in the middle and an "info panel" to indicate you the key levels. You can set an alert for each level cross.
-MTF High/Low (Red dots is last low and green dots is last high).
-Bollinger.
-Ichimoku Cloud with baseline (red) and alerts (SenkouA and SenkouB Cross or Tenkan and Kijun Cross).
Everything is fully customizable in settings.
To place an alert, always choose the "Once per bar" option.
Many functions are still to come. So don't hesitate to report bugs, suggestions and follow me to always be kept informed of the next updates to come!
//ALWAYS DELETE INDICATOR AND ALERTS AND RESET THEM AFTER AN UPDATE!
Thank again everyone for your support!
A BIG THANKS TO QUANTNOMAD FOR GIVING ME ITS AUTHORIZATION TO USE, MODIFY AND REPUBLIC ITS "Ultimate Pivot Points Alerts" script indicator:
Good trade everyone! And remember, money management is the most important!
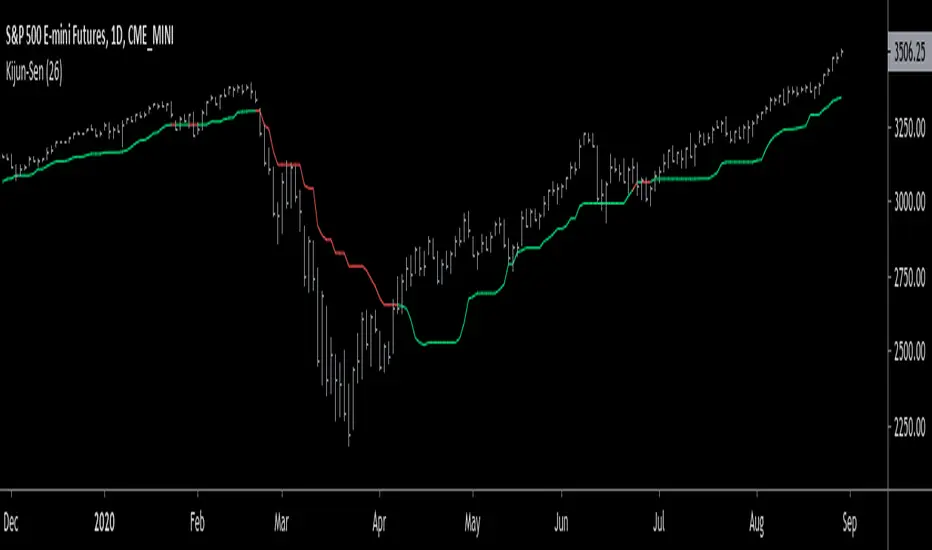
Kijun-Sen LineThe Kijun-Sen line is an indicator that helps to identify the trend; whether that's up or down.
When the line is...
Green - Market is in an uptrend
Red - Market is in a downtrend
Recommended settings: 20 - 37 (26 is best)
The Kijun-Sen line, otherwise known as Baseline is simply the middle price between the highest high & the lowest low over a given period of time.
Calculation: (Highest high + lowest low)/2 = Baseline (Kijun-Sen)
The Kijun-Sen line was developed by Japanese journalist, Goichi Hosoda in the late 1960s. It was part of an indicator called the Ichimoku Cloud, an entire trend-trading system developed by the journalist himself. In my opinion, the Kijun-Sen is the most important part of the system.
Special thanks to VP & his Nononsense Forex Youtube Channel!
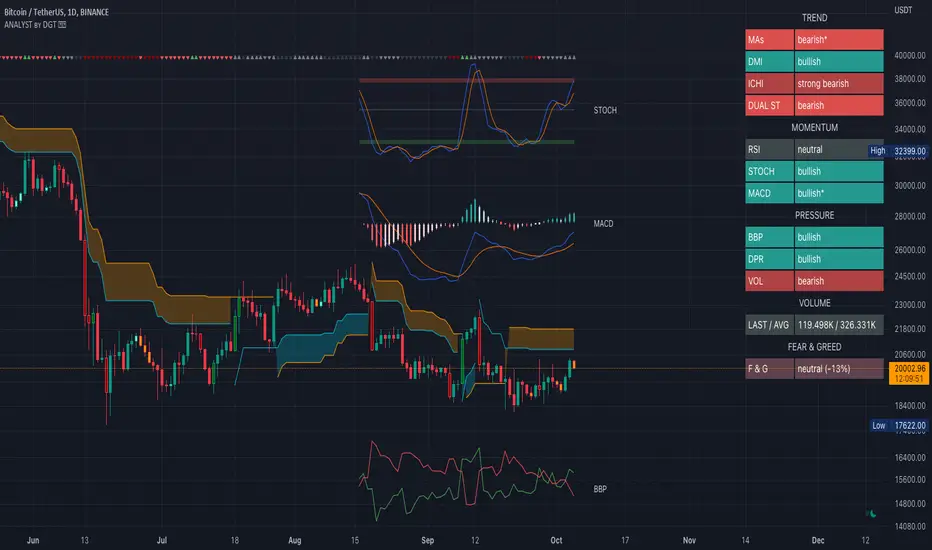
Technical Analyst by DGTWho needs a Technical Analyst?
yes I can hear someone is asking for, and here is one that can help you with technical analysis
The analyst will present a technical anlaysis report at a glance calculated by the most popular technical indicators , and the good part, the anlayst will do it voluntarily
technical skills of the analyst:
- experienced an all markets
- ability to interpret moving averages
- ability to interpret volume changes
- ability to interpret trend folowing indicators such as:
* directional movement index (dmi), identify trend strength and trend direction
* complex ichimoku cloud , identify trend stregth, and tk crosses
- ability to interpret oscillators such as:
* relative strength index, identify oversold overbought levels, identify the rsi flow
* commodity channel index, identify oversold overbought levels
* awesome identify if grawing or falling
* macd if bullish or bearish, and macd histogram if grawing or falling
- ability to calculate probability and its trend
- non-stop hardworker,
- available 7/24,
- highly dedicated always on duty,
- open for new ideas and willing to learn
- upon request the analyst will create reports with custom settings of your choise
the analyst is not a decition maker, trading success is all about following your trading strategy and the analyst aims to help with the presented reports calculated by the most popular technical indicators
the analyst supports 9 of the popular technical indicators and is willing to learn more , please share your comments and feedbacks and help the analyst improve skills
cheers!
Disclaimer : The script is for informational and educational purposes only. Use of the script does not constitutes professional and/or financial advice. You alone the sole responsibility of evaluating the script output and risks associated with the use of the script. In exchange for using the script, you agree not to hold dgtrd TradingView user liable for any possible claim for damages arising from any decision you make based on use of the script
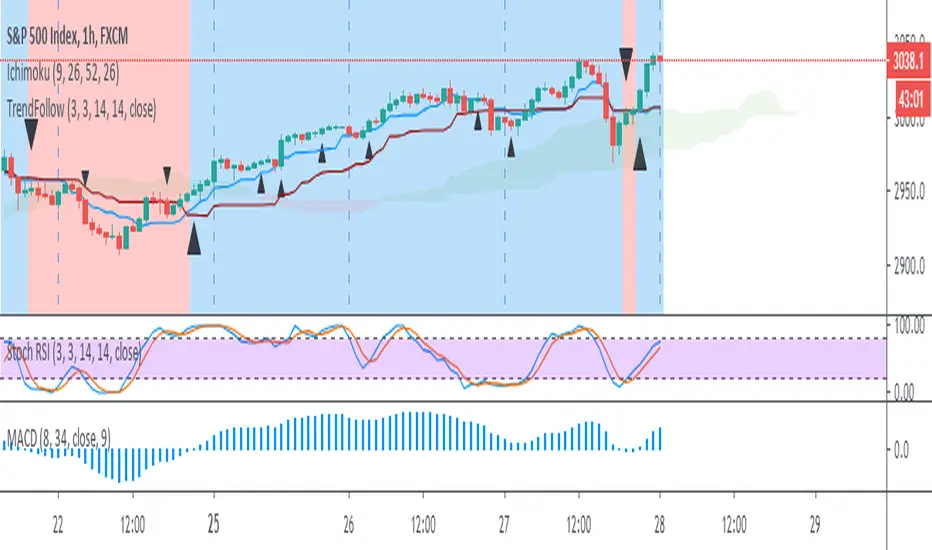
Trend Follow with 8/34 EMA and Stoch RSI for 1 Hour SPX
The script determines and plots entry points for 1 hour S&P index using 8/34 emas and stochastic RSI. When 8 ema above/below 34 ema up/down crosses of stochastic RSI are considered as long/short entries. Entry prices should be above/below high/low of the signal bars accordingly. Ichimoku cloud can be used as extra filtering.
Distance Oscillator - evoThis shows the distance to a moving average of your choice as histogram, you can select your moving average at input "Oscillator Source".
You need to have a plot on your chart (like EMA or anything else) so you can connect this indicator to it. I used Ichimoku Cloud's 20 period Conversion line (blue line) as example on the chart.
You can look for divergence on the histogram, that works because most moving averages follow price, they do not lead price. Which means if the distance gets smaller but the trend still continues, it may be a loss of momentum and often a sign for a reversal or pause.
I applied a moving average of the histogram, you can use this to wait for a cross to confirm divergence or can be useful to smooth signals a bit.
Of course you have to play around with it a little and see what works best for you, I have not tested all settings and timeframes.

Technical Analysis - Panel Info//A. Oscillators & B. Moving Averages base on TradingView's Technical Analysis by ThiagoSchmitz
//C.Pivot base on Ultimate Pivot Points Alerts by elbartt
//D. Summary & Panel info by anhnguyen14
Panel Info base on these indicators:
A. Oscillators
1. Rsi (14)
2. Stochastic (14,3,3)
3. CCI (20)
4. ADX (14)
5. AO
6. Momentum (10)
7. MACD (12,26)
8. Stoch RSI (3,3,14,14)
9. %R (14)
10. Bull bear
11. UO (7,14,28)
B. Moving Averages
1. SMA & EMA: 5-10-20-30-50-100-200
2. Ichimoku Cloud - Baseline (26)
3. Hull MA (9)
C. Pivot
1. Traditional
2. Fibonacci
3. Woodie
4. Camarilla
D. Summary
Sum_red=A_red+B_red+C_red
Sum_blue=A_blue+B_blue+C_blue
sell_point=(Sum_red/32)*100
buy_point=(Sum_blue/32)*100
sell =
Sum_red>Sum_blue
and sell_point>50
Strong_sell =
A_red>A_blue
and B_red>B_blue
and C_red>C_blue
and sell_point>50
and not crossunder(sell_point,75)
buy =
Sum_red>Sum_blue
and buy_point>50
Strong_buy =
A_red50
and not crossunder(buy_point,75)
neutral = not sell and not Strong_sell and not buy and not Strong_buy

Lancelot Band - ATR Reversal+Trending IndicatorThis is an indicator I created recently, with the mind of spotting where price might reverse and where the price is trending. You can see this as the primary indicator for your system, however, it is recommended you use this in conjunction with other confirmation indicators.
This script focus solely on ATR or Average True Range.
This indicator is the combination of the baseline from the Ichimoku cloud and the concept of the Keltner channel.
Baseline period = 14
ATR period = 14
ATR Mult = 1.5
For reversal
Long when price crossover Lower band & Stop loss at xLower band
Sell when price crossunder Upper band & Stop loss at xUpper band
For Trend Following
Long when price crossover xUpper band and Stop loss at Upper band
Short when price crossunder xLower band and Stop loss at Upper band
Again, you will need other indicators to help you to succeed in this system. This indicator will not generate the best exit for your position but will generate a good entry signal when you use it with both volume indicator and exit indicator.
Works well on BTCUSD XBTUSD, as well as other major liquid Pair.
Feel free to follow me on Twitter @Lancelot_Auger for more free Alpha.
Please acknowledge my effort by like and follow.
And lastly,
Save Hong Kong, the revolution of our times.

NOT-ONLY-SHORTThis script is the same as NOT-ONLY-LONG but without the security() function.
It use the following indicators: RMI + ADX + RSI + ICHIMOKU cloud only.
The fuchsia dot is the average price of the positions. The Take Profit is calculated from there.
It does not have Stop Loss, instead it makes a re-entry to try to improve the liquidation price.
Enjoy!

Kijun-Sen Strategy [DasanC]This strategy employs the Kijun-Sen line (from Ichimoku cloud) as a baseline for decisions.
In essence, the Kijun-Sen is a kind of moving average based on the High/Low range, similar to Donchian channels.
We wait for a crossover or crossunder to enter a new trade, then exit upon the next cross.
It works on 1H timeframe and above. It also works for all the Major FX pairs (at least from my tests).
I use the ATR and a multiplier to decide the S/L position as well as the volume of the trade.
I also use an equity protector to close out of all trades if a specific DD % level is reached. In theory, this should never happen with only one trade open at a time, however, if a user wants to modify the script to pyramid orders then the equity protector could potentially "save" an account.
The default settings should produce winning results on Major pairs. You can change the backtest time in the script by altering line #53:
>if(time > timestamp(2017,1,1,0,0) and time < timestamp(2019,1,1,0,0))
TODO:
Add 2 additional forms of confirmation
Add volume to filter losing trades
Add exit indicator

MTF Ichimoku CloudI published it because I could not find a good MTF glance.
なかなか良いMTF一目が見つからないので公開しました。
